The past few quarters have been marked by uncertainty, volatility and public market paralysis which has stretched investor confidence as portfolios got whipsawed through the news headlines and Federal Reserve tightening cycle.

Alternative investment opportunities through a slowing economy
Overview
The financial stresses exposed over this period have significantly reduced capital availability and increased capital costs.
Investor sentiment appears poor and bearish with record amounts of capital sitting in money funds and Treasury Bills (“T-Bills”). A classic case of investors waiting on the sidelines for signs of positive economic momentum.
Yet, as discussed in Wealth Outlook 2023: Mid-Year Edition, we expect to see peak short term interest rates soon, and a concentration in T-Bills and money market funds going forward which will ultimately hurt long-term returns.
Therefore, we believe investors should consider rotating their portfolios toward different risk assets, geographies and strategies in the second half of 2023 and into 2024. Alternative investments can be a key component of this for qualified investors.
Within the backdrop of 2022, alternative investments managers demonstrated their portfolio utility by generally outperforming traditional stocks and bonds (FIGURE 1). Private capital, as measured by the Pitchbook Private Capital Index, generated a positive 0.4% return1 and hedge funds, demonstrated by the HFRI Fund Weighted Compositive Index, lost just 4.2%2 in a market where the S&P 500 and MSCI World Indices experienced -18.1% total returns and the Barclays bond indices lost 11.0% and 11.2%, respectively3.
Figure 1. One Year Total Returns by Asset Class (as of December 31, 2022)
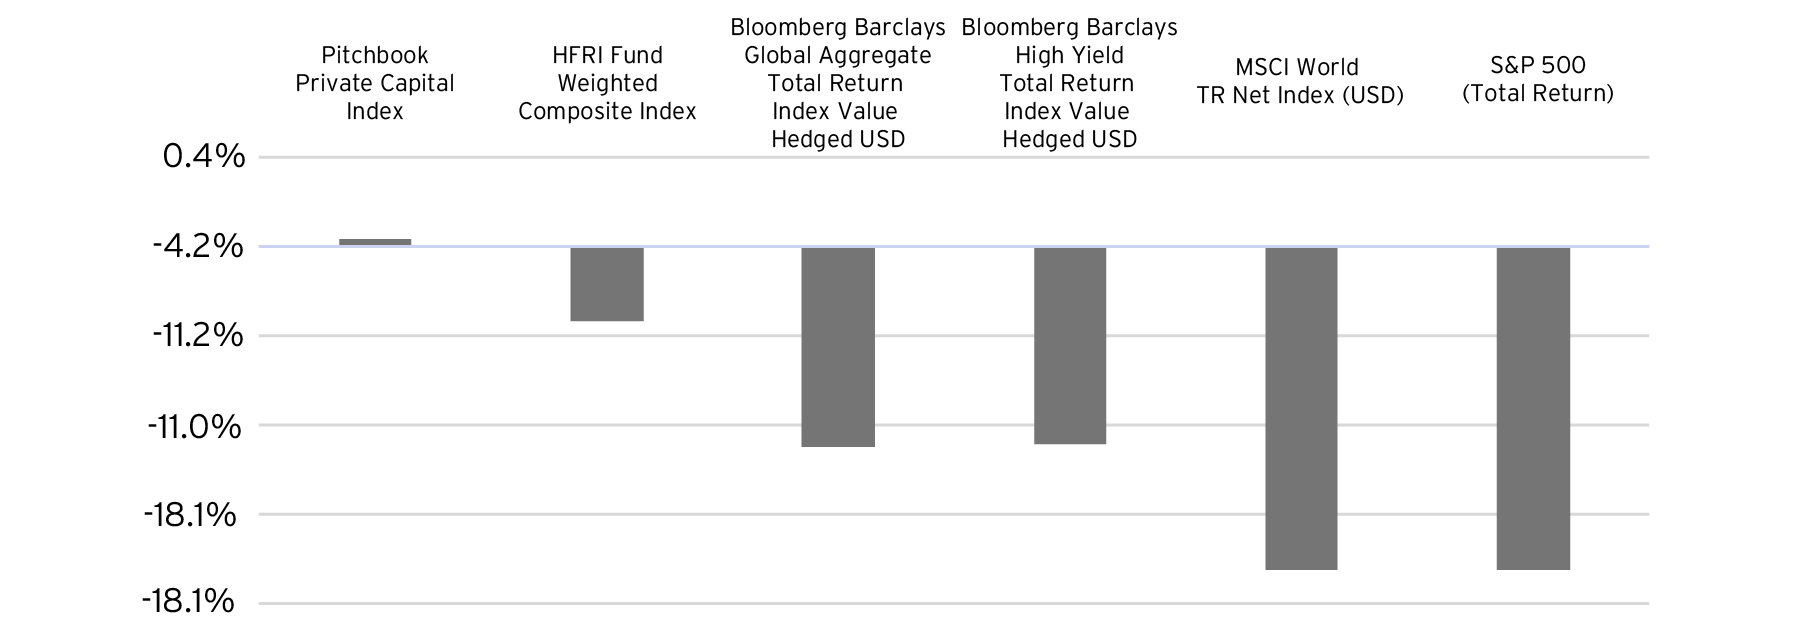
Source: Bloomberg, HFRI, Pitchbook as of December 31, 2022. Treasuries represented by Bloomberg US Treasuries Index Total Return. High Yield represented by Bloomberg US Corporate High Yield Bond Index. Global Credit is represented by Bloomberg Barclays Global Aggregate Total Return Index Value Hedged USD. Pitchbook Private Capital Index includes private equity, venture capital, real estate, private credit and infrastructure. Indices are unmanaged. An investor cannot invest directly in an index. They are shown for illustrative purposes only and do not represent the performance of any specific investment. Index returns do not include any expenses, fees or sales charges, which would lower performance. Past performance is no guarantee of future results. Real results may vary.
For risk assets, 2022 was a tumultuous period and investors experienced the concurrent collapse of both equity and fixed income markets. While the high correlation between equity and debt markets has declined in the first part of the year, 2023 continues to present significant stresses for investors. Macroeconomic uncertainty, regional banking failures, persistent inflation, peaking interest rates, recession fears and volatile public equity and debt markets are among the challenges that are unsettling investors and portfolios.
However, we believe that this turmoil may lead to potential opportunities in private equity, real estate and hedge funds over the coming 12 to 24 months as alternatives managers leverage their capital positions to take advantage of market volatility, dislocation, and stressed situations.
| Asset Class | 2023 SRE | 2022 SRE |
|---|---|---|
| Developed Market Equities | 7.0% | 3.8% |
| Emerging Market Equities | 12.9% | 8.1% |
| Investment Grade Fixed Income | 4.6% | 1.8% |
| High Yield Fixed Income | 7.4% | 2.6% |
| Emerging Market Fixed Income | 7.8% | 3.6% |
| Cash | 3.4% | 0.9% |
| Hedge Funds | 9.1% | 4.1% |
| Private Equity | 17.6% | 11.6% |
| Real Estate | 10.6% | 8.8% |
| Commodities | 2.4% | 1.5% |
Source: Citi Global Wealth Investments’ data as of October 31, 2022. Strategic Return Estimates (“SRE”) based on indices are Citi Global Wealth Investments’ forecast of returns over a 10-year time horizon for specific asset classes (to which the index belongs). 2022 SREs are based on data as of October 31, 2021. Indices are used to proxy for each asset class. Cash refers to the US Cash SRE. The forecast for each specific asset class is made using a proprietary methodology that is appropriate for that asset class. Equity asset classes use a proprietary forecasting methodology based on the assumption that equity valuations revert to their long-term trend over time. The methodology is built around specific valuation measures that require several stages of calculation. Assumptions on the projected growth of earnings and dividends are additionally applied to calculate the SRE of the equity asset class. Hedge Fund and Private Equity SREs are linked to equity SREs. Fixed Income asset class forecasts use a proprietary forecasting methodology that is based on current yield levels. Other asset classes use other specific forecasting methodologies. SREs are in US dollars. SREs are generally updated on an annual basis, however they may be updated off cycle based on market conditions or methodology adjustments. Strategic Return Estimates are no guarantee of future performance. SREs do not reflect the deduction of client fees and expenses. Future rates of return cannot be predicted with certainty. Investments that pay higher rates of return are often subject to higher risk and greater potential loss in an extreme scenario. The actual rate of return on investments can vary widely. This includes the potential loss of principal on your investment. It is not possible to invest directly in an index. All SRE information shown above is hypothetical not the actual performance of any client account. Hypothetical information reflects the application of a model methodology and selection of securities in hindsight. No hypothetical record can completely account for the impact of financial risk in actual trading.
At an asset class level, the long-term outlook for private equity, real estate and hedge funds now looks much brighter.
Based on Citi Global Wealth Investments’ Adaptive Valuation Strategies (“AVS”) methodology, the forecasted Strategic Return Estimates (“SREs”) annualized ten-year returns for private equity, real estate and hedge funds are 17.6%, 10.6% and 9.1%, respectively (FIGURE 2). These SREs stood at 11.6%, 8.8% and 4.1% at mid-year 2022. The 2022 sell-off and continued public market weakness has led to valuations becoming more normalized, or in some cases, at historic lows. These cheaper valuations may potentially lead to improved return expectations.
The private equity SRE is 17.6%. This is derived from small-cap public equity valuations, which continue to be at historically inexpensive levels, despite the recent large-cap rally. In the short term, we are experiencing fewer deals with higher financing costs. Nevertheless, in the long run, current lower valuations would lead to more favorable and rewarding opportunities for long term investors. The SRE for real estate is 10.6%, reflecting the current valuation environment in certain commercial real estate sectors, such as office and retail. The SRE for hedge funds is 9.1%, led by the long/short equity and event driven sub-asset classes.
How much should qualified investors allocate to alternatives?
Based on AVS’ long-term return forecasts, there are suggested and hypothetical asset class weightings. Overall, most asset class attractiveness has improved over the last year due to market movements.
However, the strategic allocations are driven by relative estimated returns among these asset classes. All else equal, it proposes larger allocations to asset classes with higher SREs and smaller allocations to those with lower SREs. Of course, not all investors have an appetite or are qualified for the risks associated with alternatives. Please see a full discussion of alternatives risks on page 37.
FIGURE 3 shows the suggested allocation for an investor at Risk Level 3 and for whom alternative and illiquid asset classes are suitable. Risk Level 3 seeks modest capital appreciation and, secondly, capital preservation. Together, hedge funds, private equity and real estate make up more than one quarter of the suggested allocation at 12%, 10%, and 5%, respectively.
It is important to note that this allocation remains unchanged from last year, as a consistent approach to illiquid alternatives across cycles is generally suggested.
| Asset Class | AVS Risk Level 3 Allocation |
|---|---|
| Developed Market Equities |
27.4% |
| Emerging Market Equities |
4.6% |
| Investment Grade Fixed Income |
32.4% |
| High Yield Fixed Income |
3.3% |
| Emerging Market Fixed Income |
3.3% |
| Cash |
2.0% |
| Hedge Funds |
12.0% |
| Private Equity |
10.0% |
| Real Estate |
5.0% |
| Commodities |
0.0% |
Source: Citi Global Wealth Investments Global Asset Allocation team The allocation shown is a US dollar Allocation at Risk Level 3, as of October 31, 2022. The allocation was updated on January 1, 2023, using data as of October 31, 2022. Risk levels are an indication of clients’ appetite for risk, ranging from 1 (the most conservative) to 5 (the most aggressive). Risk Level 3 seeks modest capital appreciation and, secondly, capital preservation. Diversification does not ensure against loss of investment. See Glossary for asset class definitions.
The state of the alternatives market
Private capital markets have not been immune to the volatility and pressures experienced in capital markets. The macroeconomic climate continues to cast a shadow over alternatives across fundraising, exits and dealmaking. However, many alternative asset managers are positioned to step into potential opportunities where market stress has created imbalances and securities have been mispriced or competing sources of capital are sidelined by market dynamics.
A key factor to consider in the current environment is the significant decline in exit activity. Exit values declined for the third consecutive quarter in the first quarter of 2023. US private equity exit value was down 63% year over year in 2022 and Q1 2023 exits were down a further 34% from the same period in 2022. Initial public offering (“IPO”) markets continue to be effectively closed, with only four US private equity-backed IPOs in the first quarter of 2023, versus an average of 17 IPOs per quarter for 2016 through 2021. The only private equity exit path that remained truly active, albeit at significantly reduced levels, was exits to corporate buyers, representing 70% of all exits in the first quarter of 2023 (FIGURE 4).
Figure 4. US Private Equity Exits by Type
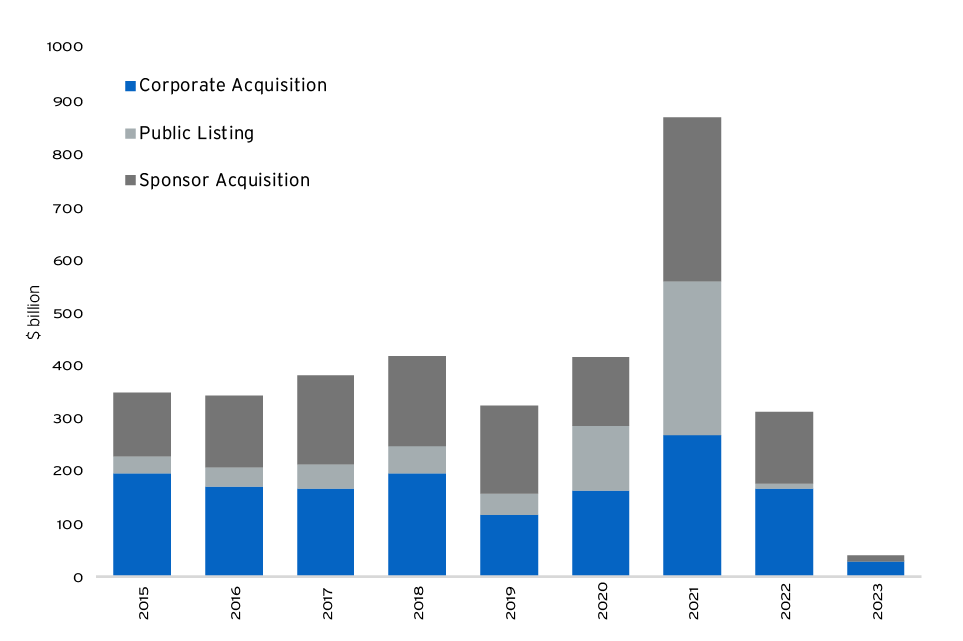
Source: Pitchbook as of March 31, 2023. Past performance is no guarantee of future results. Real results may vary.
From a global private capital fundraising perspective, 2022 was down $318.8 billion to $1.2 trillion from the record raises of $1.6 trillion in 2021, a 25% decline. The fundraising trendline continued downward with Q1 2023 at $210.8 billion (FIGURE 5), a 42% decline year over year for the same period. The fundraising slowdown is in part driven by investors becoming overexposed to illiquid funds (relative to allocation targets) due to depressed public market portfolio valuations and a lack of capital returned from private investments as a result of the slowdown in existing portfolio exits.
However, there has also been a focus on scale and quality. With limited partnerships (“LPs”) focused on their most core relationships, funds greater than $1 billion in size secured 75% of all fundraising in 2022 and through Q1 2023. From 2017 to 2021, these funds reflected 61% of capital raised.4 So despite a lower fundraising environment, a subset of the higher quality managers have dry powder available to execute their investment strategies and take advantage of potentially more attractive valuations and/or market dislocations.
Figure 5. Global Private Capital Fundraising is Down
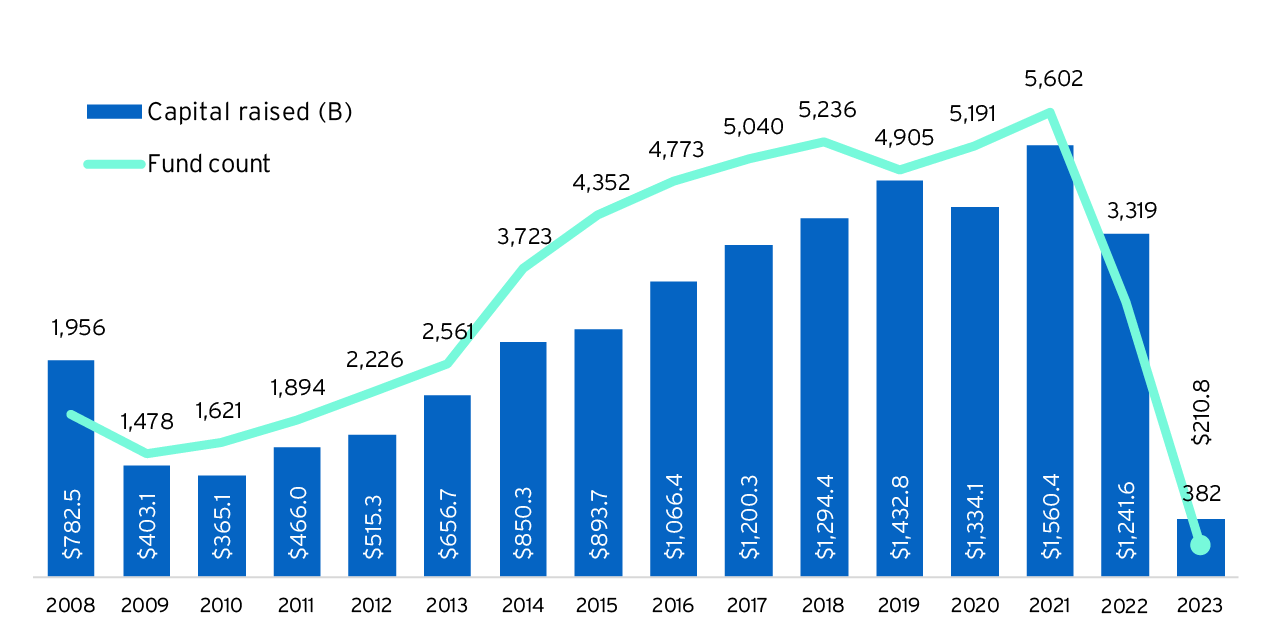
Source: Pitchbook as of March 31, 2023. Pitchbook Private Capital includes all global private equity, venture capital, real estate, private credit and infrastructure funds tracked by Pitchbook.
This can be seen in the fact that US private equity deal volume in Q1 2023 was up 11.4% from Q4 2022 with approximately $261.4 billion. Overall, this represents a downward trend from the peaks of 2021, but is still well above the pre-COVID average of $180.3 billion per quarter. The cost and limited availability of credit capital means that managers must finance deals more conservatively with lower leverage and have high confidence in their ability to drive improved financial performance at the company level.
With these changes, valuations are coming down to reflect the new reality. For example, the median enterprise value to revenue multiple for the quarter ending March 31, 2023 was 1.7x for buyout deals in North America and Europe. This is down 32%, from a peak of 2.5x in 2021.5
Figure 6. North America and Europe Private Equity EV/Revenue Multiples Declined in Q1 2023
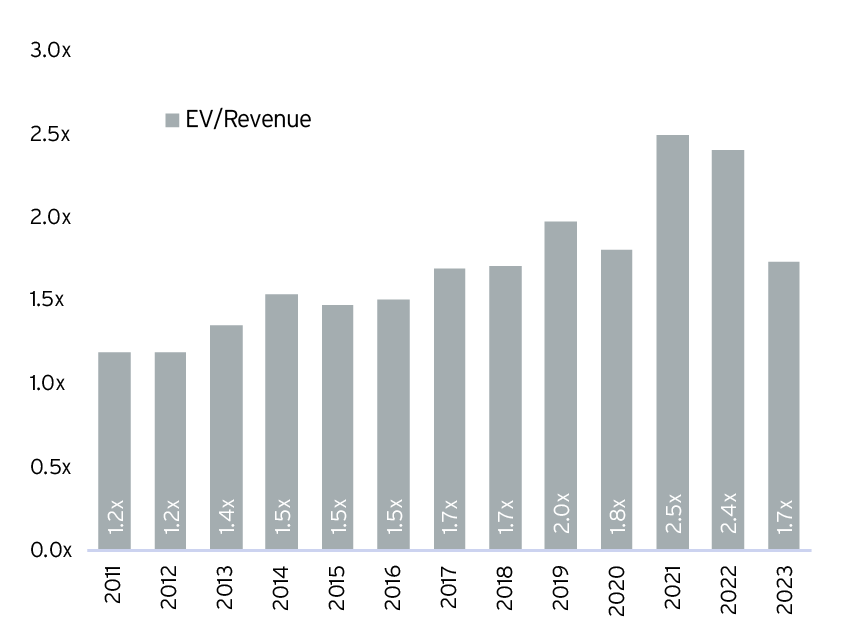
Source: Pitchbook as of March 31, 2023. Past performance is no guarantee of future results. Real results may vary.
Hedge funds saw an uptick in net capital flows in the first quarter of 2023 as macroeconomic and financial risks and volatility increased significantly on the back of regional bank failures and other dislocations. Despite this, hedge funds were able to deliver positive performance. The HFRI Fund Weighted Composite Index gained 1.2% in the first quarter, led by both equity hedge and event-driven strategies. Investors allocated an estimated $9.1 billion in new capital to the hedge fund industryin the first quarter and hedge funds saw performance gains to bring total global hedge fund capital to $3.88 trillion. Investors allocated new capital to hedge funds in Q1 to opportunistically take advantage of the current market volatility while managing downside risk.
From a strategy perspective, macro and relative value, including multi-strategy funds, remained in focus, while equity hedge strategies also saw notable net asset inflows after being out of favor in 2022 amid declines in the broader equity markets.6
Bonds are back again: Where to find potential fixed income and yield opportunities now
In the short-term, staying invested in cash or ultra short-term fixed income securities represents a risk to medium-term returns as reinvestment may occur at lower future yields. Over the balance of 2023, interest rates are expected to reach peak levels for this cycle. As core inflation levels are only falling gradually, rate cuts are unlikely in through the balance of 2023, but may occur in early 2024.
Yield-focused investors may have an opportunity to diversify portfolios and achieve high levels of income. As banks reduce lending and capital markets become less liquid, investors may be able to increase their bond returns by changing where and how they invest. In addition to seeking high quality, longer duration securities, qualified investors who have a higher risk appetite can look to alternatives to take advantage of the volatility and uncertainty that continue to define the current market.
Bond market implied volatility rose to twice its long-term average as measured by the MOVE Index in the second half of 2022 and has remained elevated ever since. This volatility peaked at 180.1 on March 13, 2023 after the Silicon Valley Bank and Signature Bank failures, the highest level since the Global Financial Crisis (FIGURE 7). As of May 23, 2023, the MOVE Index remained elevated at 131.7, signaling continued uncertainty.
Figure 7. US Treasury Bond Volatility
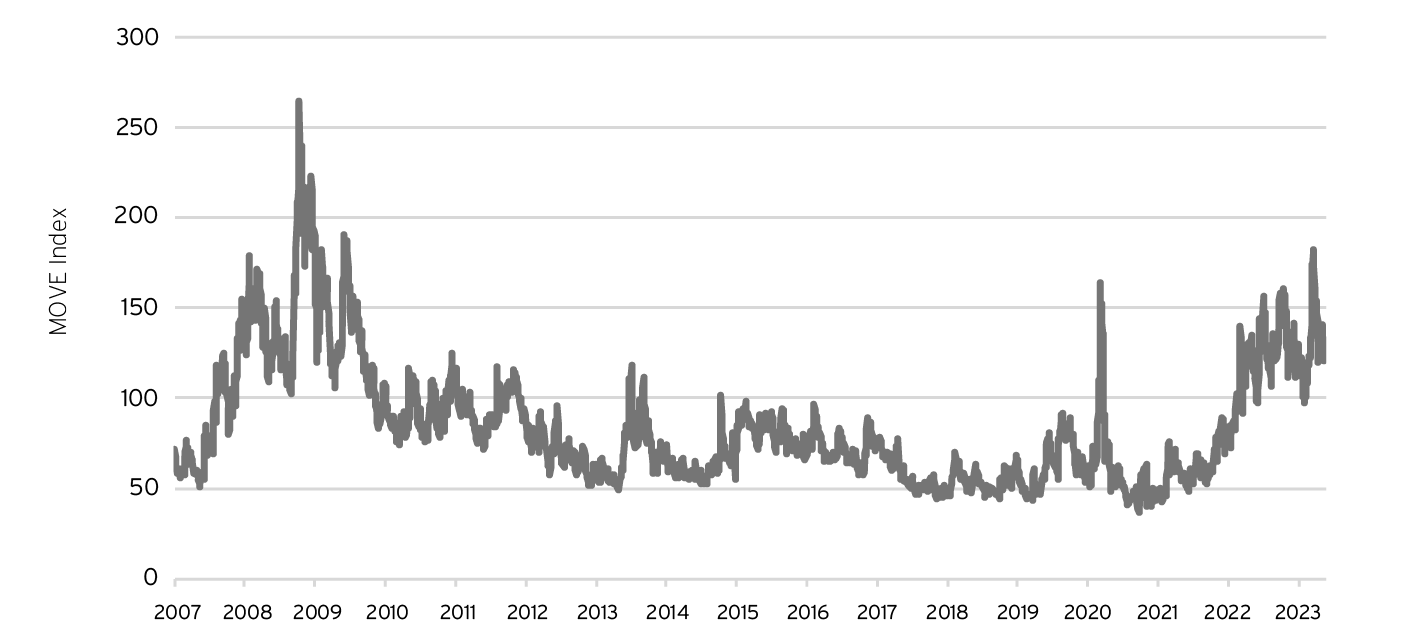
Source: Bloomberg as of May 23, 2023. Indices are unmanaged. An investor cannot invest directly in an index. They are shown for illustrative purposes only and do not represent the performance of any specific investment. Index returns do not include any expenses, fees or sales charges, which would lower performance. Past performance is no guarantee of future results. Real results may vary.
Given the stresses on deposits, regional banks will likely need to reposition their portfolios, selling more treasuries and mortgages, in order to meet upcoming stress tests. This, in turn, may lead to an increase in both volume and volatility, presenting opportunities for fixed income-focused hedge funds.
Additionally, in credit markets, the absence of bank lending, lower ETF and CLO volume, and concerns about corporate profits going forward have created a series of related opportunities to be the prime liquidity provider in the market, but within the risk and context of continued economic uncertainty. Acquiring the credits of fundamentally sound companies at attractive valuations requires significant breadth of knowledge and may provide both downside mitigation and potential future appreciation, if done well. We should expect continued volatility, which can allow fixed income investors to exercise their bond-picking skills.
Furthermore, structured credit markets are relatively inefficient, and often face pressure in less liquid market environments. These selloffs can be magnified by forced selling from daily-liquid vehicles facing redemptions. As a result, spreads across residential and consumer debt markets have widened meaningfully over the last twelve months, even doubling in certain subsects of the market. Certain hedge fund strategies can act as liquidity providers to forced-sellers by utilizing free capital to opportunistically rotate into high-quality assets that are selling at steep discounts for non-economic reasons.
While the ability of companies to access the capital markets saw some relief early this year with a 12.5% increase in leveraged loan volume in the first two months of 2023 over the last two months of 20227, pressures from the financial sector continue to challenge access to credit markets. Given the rapid rise in yields and the uncertain outlook for corporate profits, both credit and equity markets have largely remained closed to companies wishing to raise capital since mid-2022. The few borrowers who are able to come to the public market will need to sacrifice on structure and price to stimulate interest, providing bond and loan investors better protection and higher yields on performing credit. The average for a unitranche middle market loan has risen to 680 bps over the Secured Overnight Financing Rate (“SOFR”), driving new issue rates near 12% (FIGURE 8).7
Figure 8. New Issue Yields Continue to Rise
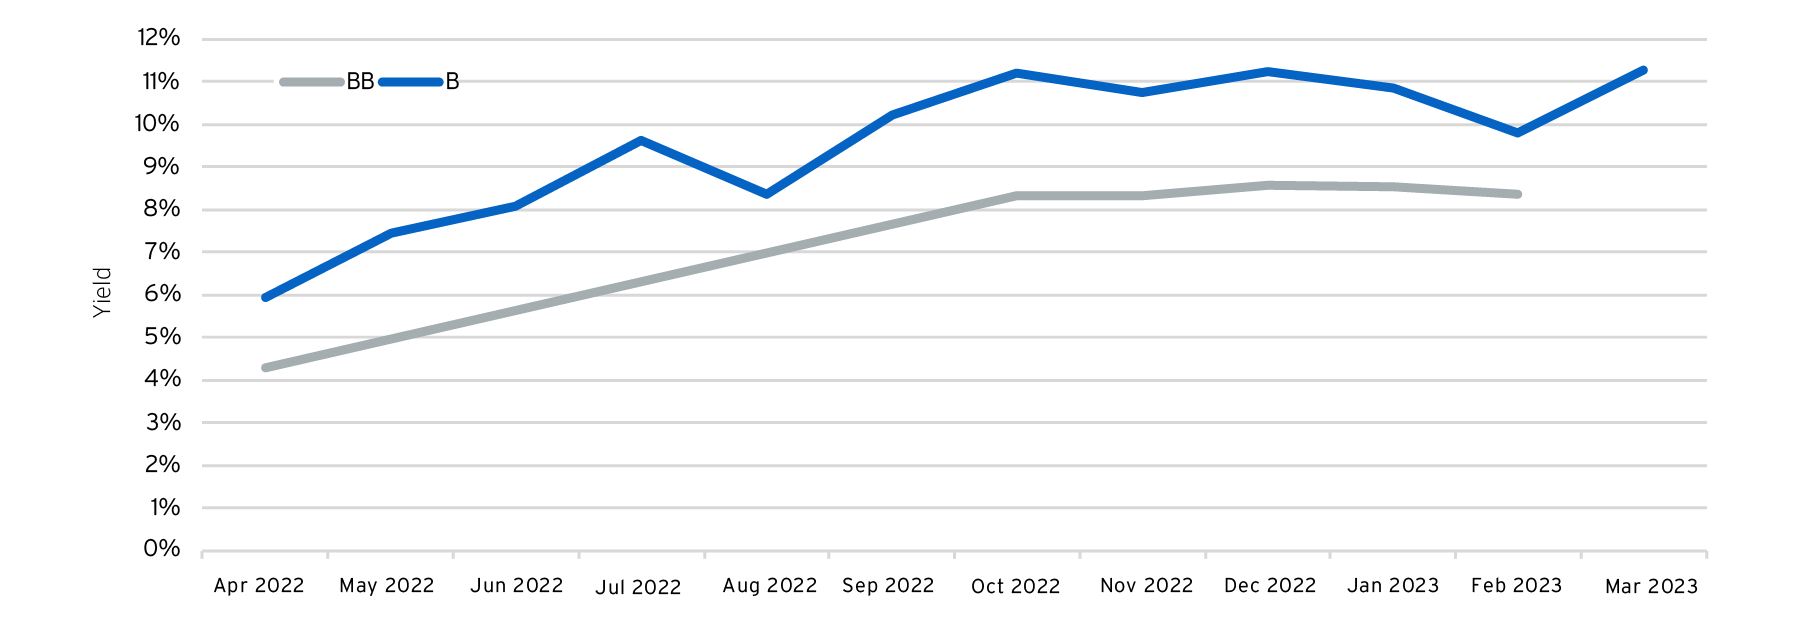
Source: LCD as of March 31, 2023. Indices are unmanaged. An investor cannot invest directly in an index. They are shown for illustrative purposes only and do not represent the performance of any specific investment. Index returns do not include any expenses, fees or sales charges, which would lower performance. Past performance is no guarantee of future results. Real results may vary.
Given the lack of liquidity in public markets for new issues, the overall availability of debt has fallen, and new buyout deals in the latter half of 2022 into Q1 2023 were being structured with 1.0x to 2.0x lower debt multiples than in 2020 and 2021.8 Private lenders such as direct lending funds and Business Development Companies (“BDCs”) may benefit from a market where companies are not able to rely on public bond and high yield markets for their financing needs.
For example, in the aftermath of the collapse of Silicon Valley Bank, one of the largest primary lenders to the technology sector, a direct lender providing senior secured floating rate direct loans to technology companies becomes a key liquidity provider to the sector. The technology sector provides mission critical solutions to customers, potentially leading to high customer retention rates and stable revenues. This, and the long-term secular tailwinds around digitization make for a compelling investment thesis for lending.
Real estate funds seeking income generation, downside risk mitigation and our high conviction subsectors, such as multi-family residential and industrial, may be well positioned to benefit from underlying income growth. These sectors can benefit from the secular and market dynamics that are driving higher demand for space relative to the supply, such as urbanization, digitization, and inflation mitigation.
Despite new supply, US industrial vacancy was 3.5% as of Q1 2023 and remains below the 5.0% historical average. For the multifamily sector, while rental growth is moderating from pandemic highs, as of Q1 2023 net effective rent increased 4.5% relative to Q1 2023, which remains above the pre-covid average of 2.7%.9
Comparatively, in terms of the office sector, post-pandemic global office utilization is at 50% of inventory and the sector faces additional headwinds from volatile capital markets and a slowdown in the economy, particularly in the United States.10 In particular, “return to office” in the US is lagging Europe and Asia, since in the US there are larger living spaces affording more in home flexibility, generally longer commutes and a tighter labor market.
A sequence of equity opportunities: Finding value beyond narrow leadership
Unlike 2022 when markets were closely correlated, this year has seen a renewed divergence, leading to potential sequential investment opportunities across regions. For alternative investments, this drives two distinct investment themes across equity and other asset classes:
- First, we are focused on strategies specifically suited to capitalizing on liquidity dislocations in capital markets and private markets to seek equity-like returns
- Secondly, for equity investments, we are focused on strategies across hedge funds and private equity that may add value via active management for asset selection and operational improvement
Positioning for market dislocations
For the second half of 2023, we believe alternative asset managers are positioned to pursue opportunities where many competitors are limited by market or liquidity constraints.This is where liquidity becomes a differentiator between the “haves” and “have-nots” in these strategies.
For example, in periods of uncertainty and volatility, credit managers with stable capital and expertise in security selection can often take advantage market dislocations. If one looks at the high-yield bond market’s five biggest declines: four recessions including the global financial crisis as well as the 2015–2016 wave of energy sector defaults, the average 24-month return for the HFRI ED: Distressed/Restructuring Index was approximately 45% (FIGURE 9).
| Begin | End | Bloomberg Barclays Global High Yield Total Return Index Drawdown | HFRI ED: Distressed / Restructuring Index Forward 24M Return | |
|---|---|---|---|---|
|
Early 90s recession |
July 31, 1990 |
Oct 31, 1990 |
-11.2% |
66.0% |
| Dot-com bust |
Feb 28, 2001 |
Sept 30, 2001 |
-8.7% |
30.7% |
| Global Financial Crisis |
May 31, 2007 |
Nov 30, 2008 |
-33.2% |
34.8% |
| Energy sector's wave of defaults |
May 31, 2015 |
Jan 31, 2016 |
-9.8% |
27.8% |
| Early COVID pandemic |
Jan 31, 2020 |
Mar 31, 2020 |
-13.1% |
48.2% |
Source: Bloomberg, HFR, as of December 31, 2022. Indices are unmanaged. An investor cannot invest directly in an index. They are shown for illustrative purposes only and do not represent the performance of any specific investment. Index returns do not include any expenses, fees or sales charges, which would lower performance. Past performance is no guarantee of future results. Real results may vary. Table shows five significant selloffs in high-yield bonds and the subsequent 24-month returns of the HFRI ED Distressed/Restructuring Index.
The lack of capital market access will also mean that certain borrowers will be forced to restructure their balance sheets and reduce debt, providing opportunity for distressed investors to buy debt at discounted prices and take an active approach to capture higher recovery values. Opportunistic credit funds will be able to take advantage of volatility and dislocations created from the uncertainty of capital market access. With locked up capital, they can be patient in order to exploit wide dispersions between the best and worst performing credit securities.
Credit markets are not the only place where providers of liquidity can differentiate themselves in times of stress. For example, in illiquid alternatives, certain institutional limited partners are struggling to work through the asset class imbalances in their portfolios brought on by public market declines and the slowdown in portfolio exits that occurred in 2022. The secondary private equity sector has developed and grown over the past 20+ years to provide liquidity solutions and flexibility in an otherwise illiquid market.
Historically, secondary transactions were primarily LP-led, where an investor sought to sell limited partnership interests in a fund or a portfolio of funds to a secondary buyer. However, in times of valuation uncertainty, secondary buyers will typically make offers that have significant discounts to NAV, thus discouraging many LPs from transacting. Despite this, 2021 and 2022 were first years that transaction volume surpassed $100 billion.
However, it is also falling on general partners (“GPs”) to find ways to enhance distributions and liquidity for their investors during a period where traditional exit paths are closed. This is driving the increasing popularity of GP-led secondary transactions in the market, now representing 50% of all secondary transaction volume (FIGURE 10). In a GP-led secondary transaction, a fund manager decides to sell one or more existing portfolio companies into a new investment vehicle which is overseen by the same manager. To mitigate potential conflicts of interest, the GP utilizes a third party (the secondary firm) to anchor the acquisition and negotiate an arms-length transaction for the assets. One of the key advantages of GP-led secondary transactions within the context of today’s credit market is that it they are not dependent on the capital markets for execution as they are, in most cases, able to leverage the existing credit facilities versus obtaining new debt.
Figure 10. Increasing Share of Annual Secondary Transaction Volume Represented by GP-led Transactions
Source: Jefferies & Co. as of December 31, 2022
Active management to seek out quality and value in volatile times
Global equities, as measured by the MSCI World Index, generated annualized returns of approximately 15% from 2017 to 2021, with three of those five calendar years having total returns above 20%.11 Given this attractive return from simple beta exposure, passive investment strategies have come to dominate the equity investing landscape.
With the financial stresses and uncertainty we have seen over the past 18 months, the ability to generate alpha rather than relying solely on beta has become a key consideration for investors in today’s environment. However, this is dependent upon manager selection and if high levels of correlation return to equity markets it becomes more difficult to outperform a simple beta exposure in the long term.
In the last ten years, the percentage of capital allocated to passively managed equity ETFs and mutual funds has gone from 33% to 55%.12 As these funds do not take active roles in their portfolio companies, despite being large shareholders, there has been a shift in company boards away from investors and towards independent board members without much equity ownership in the company. This less engaged shareholder and board dynamic potentially creates a situation where management teams are less aligned with shareholders with few checks and balances at the board-level.
This is where activist hedge fund investors have looked to step into companies and take a fully-engaged, private equity-like approach to ownership. Activist managers evaluate a company’s business model, industry dynamic, and what is causing a perceived valuation gap and seek to work with management and other shareholders to close that gap. This does not mean that activist investors target low quality companies. Rather, they focus on quality investments, as defined below, that are trading at a significant gap to their intrinsic value for idiosyncratic reasons.
Equity hedge fund strategies focusing on systematically investing in quality companies also have the potential to generate alpha in a passive world. While the definition of a “quality” investment may differ substantially from investor to investor, in general, high quality companies tend to have a combination of:
- high profit margins
- healthy balance sheets
- growing profits and/or dividends
- stable future cash flows
- strong management
- sustainable competitive advantage
A stock portfolio with a quality bias has historically demonstrated stronger comparative returns than a more diversified broad-based portfolio.
FIGURE 11 shows the cumulative returns for the S&P 500, the S&P 500 Quality Index (which tracks the top 100 companies in the S&P 500 based on return on equity, accrual ratios, and financial leverage), the S&P 500 – Lowest Quintile Index (which tracks the lowest 100 companies in the S&P 500 based on the aforementioned measures) and the S&P 500 150/50 Quality Index (which takes a levered long position in the quality index and a short position in the lowest quest quintile index).
It is evident that actively taking long exposure to quality and short exposure to the lowest quintile can provide additional returns for investors. Historically, not only have quality companies outperformed the broader market, but companies that are of the lowest quality and have the opposite characteristics of those mentioned above have significantly lagged the broader market.
Figure 11. Dispersion of Highest to Lowest Quality Quintile Returns
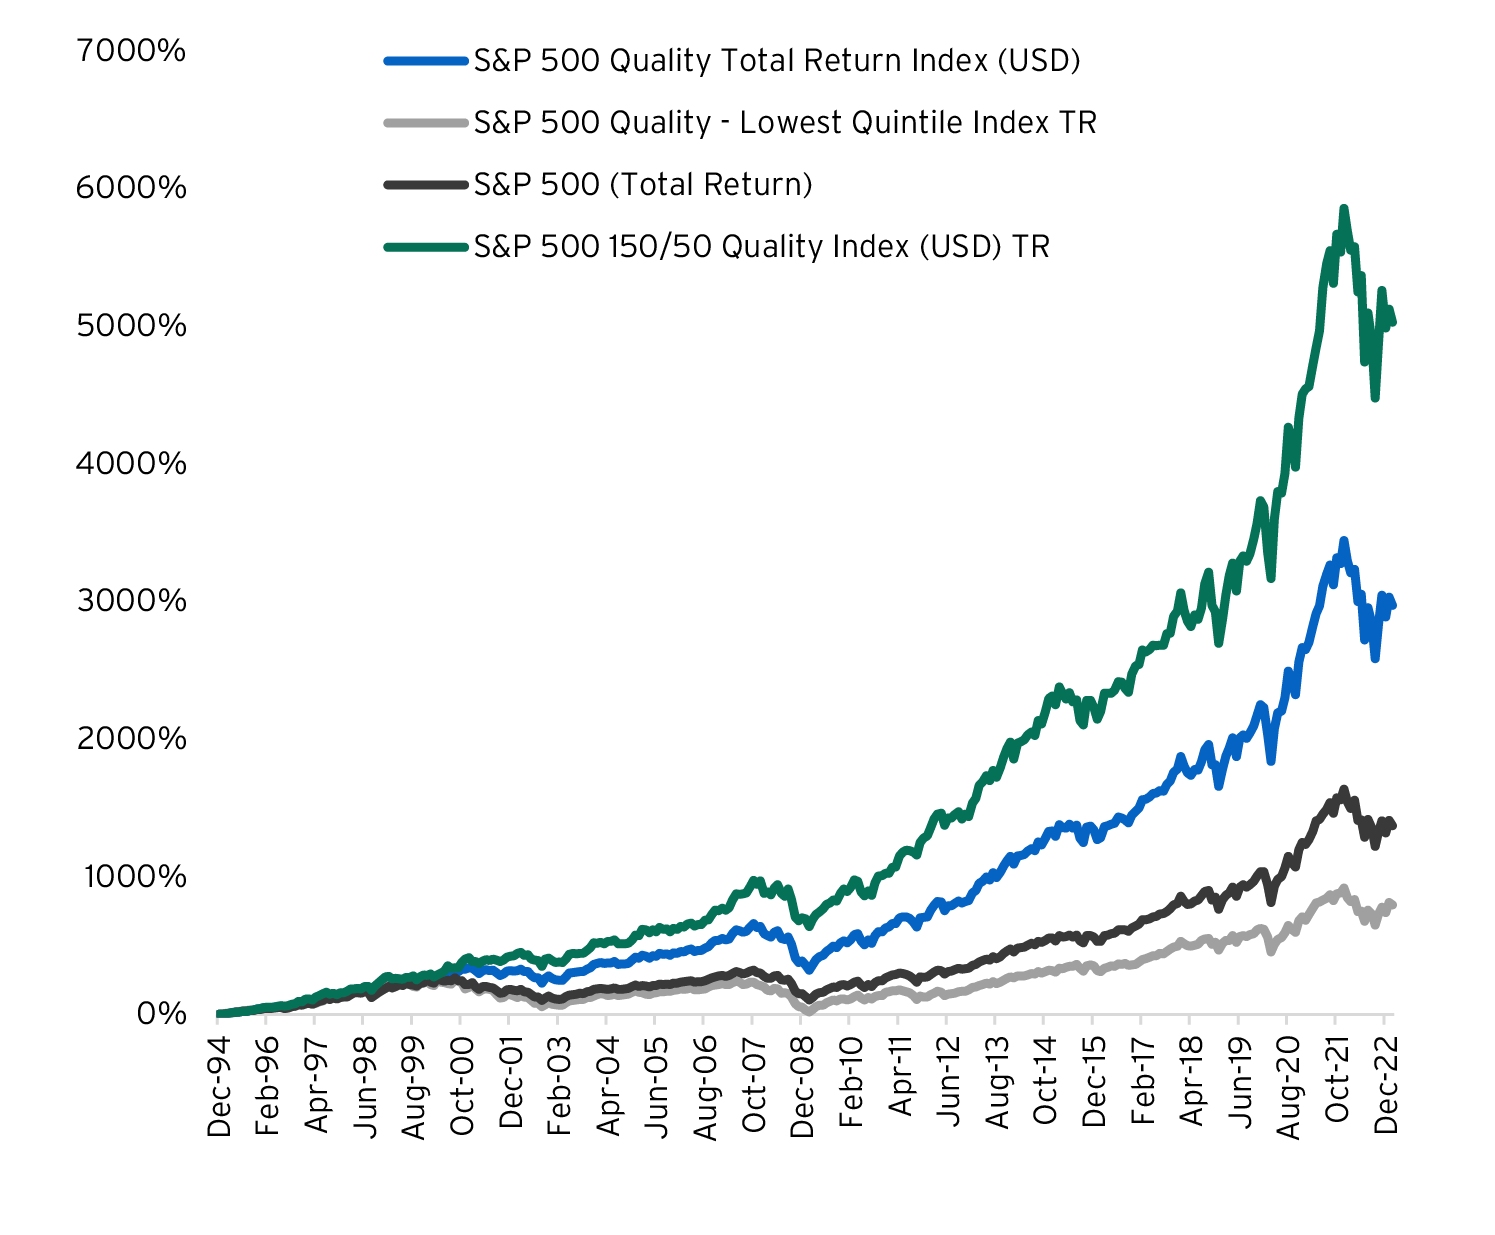
Source: Bloomberg as of March 31, 2023; Indices are unmanaged. An investor cannot invest directly in an index. They are shown for illustrative purposes only and do not represent the performance of any specific investment. Index returns do not include any expenses, fees or sales charges, which would lower performance. Past performance is no guarantee of future results. Real results may vary.
The increasing cost and reduced availability of leverage is also expected to exert downward pressure on private market valuations over the coming quarters as private equity teams build these variables into their underwriting models. Therefore, an emphasis on fundamental operational improvement becomes the priority in buyout deal execution and we are emphasizing middle-market buyout managers with such operational focus. Buyout strategies with a deep operational attention that actively manage their companies to improve revenues and profitability are positioned to drive returns through the current landscape.
Historically, buyout deal flow has recorded reduced activity levels during troubled times, as debt capital becomes scarce. However, buyout firms that have significant dry powder, have a structural advantage for new opportunities during periods of market stress when other investors are sidelined. Managers will then seek out and evaluate windows of opportunity to take advantage of pockets of capital scarcity. The upshot of lower potential entry valuations driven by public market weakness and financial stress is that buyout returns have historically trended upward after public markets have experienced declines more than 20% (FIGURE 12).
After these declines, buyout net internal rates of return (“IRRs”) have subsequently trended upward by an average of 558 basis points in the two years after the start of the last four bear markets. Top managers with available capital may then be able to reinforce their market leading positions. The repricing of the public companies’ multiples also has the potential to provide opportunities for buyout funds active in the software sector, as public-to-private transactions may become more prevalent and lower entry levels may help generate returns.
Figure 12. Global Buyout Returns After Bear Markets
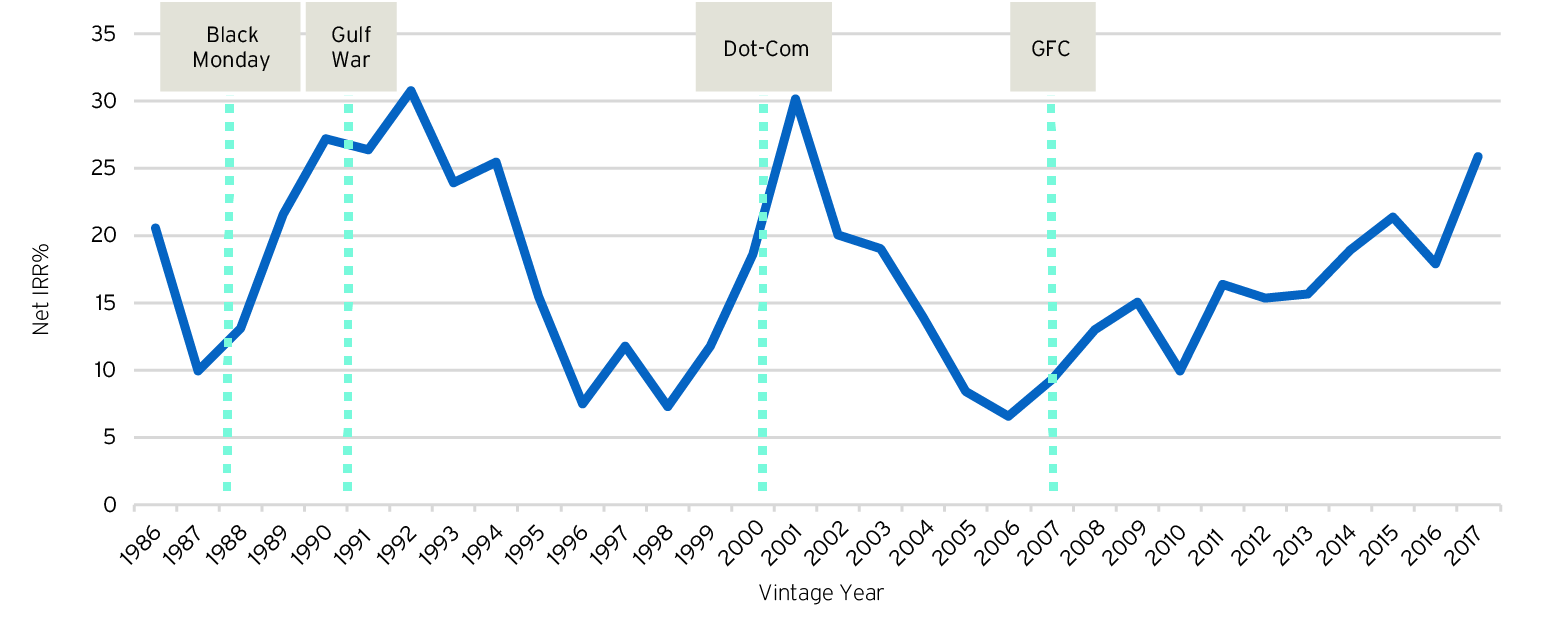
Source: Cambridge Associates and Bloomberg, as of September 30, 2022. Yellow lines show beginning of bear markets. Indices are unmanaged. An investor cannot invest directly in an index. They are shown for illustrative purposes only and do not represent the performance of any specific investment. Index returns are net of underlying fund management fees, expenses and carry but do not include any additional expenses, fees or sales charges, which would lower performance. Past performance is no guarantee of future results. Real results may vary.
Unstoppable Trends are changing the world
Unstoppable Trends continue to prove themselves as major, multi-year trends that are likely to transform the world around us, including technological advances, demographic developments, and new behaviors.
Digitization
Citi Global Wealth Investments has consistently highlighted the accelerating adoption of technology across almost every industry and business, creating a “new normal” of an increasingly data-enabled, decentralized, and flexible global economy.Trends including artificial intelligence, 5G, fintech, and cybersecurity are accelerating and revolutionizing the world around us as we become ever more connected and reliant on innovation.
Historically, a robust venture capital and growth equity ecosystem has been the engine of innovation, incubating the fastest-growing companies in the world and we continue to seek differentiated managers across all stages of development.
Accordingly, venture capital and growth opportunities for leading edge technologies that have the promise to provide novel solutions to today’s problems and disrupt legacy industries. At the same time, we are seeking to mitigate much of the technology risk by investing with managers focused on companies with developed products and customers and significant value-add capabilities.
With IPO markets currently stalled, disciplined growth managers will be well-positioned to make follow-on equity investments into high-growth companies that will need to wait longer prior to IPO, likely at relatively better valuations driven by the reset in public company multiples. Companies that raised capital at lofty valuations in 2021 are now having to seek new investment in a new valuation environment in 2023.
Cloud applications and new developments such as artificial intelligence (“AI”) are generating an accelerating pace of data creation. The AI market size alone is projected to reach $407 billion by 2027, up from $86.9 billion in revenue in 2022.13 This is, in turn, creating substantial storage and computing demand that cannot be met by today’s global digital infrastructure.
For example, 43% of the total data volume generated in history was created in the last two years (FIGURE 13). The demand for new data infrastructure is incessant and we believe that managers specializing in digital infrastructure are best positioned to leverage their direct relationships with the largest generators of storage and bandwidth to effectively provide the needed infrastructure.
Figure 13. Volume of Data/Information Created, Captured, Copied, and Consumed Worldwide
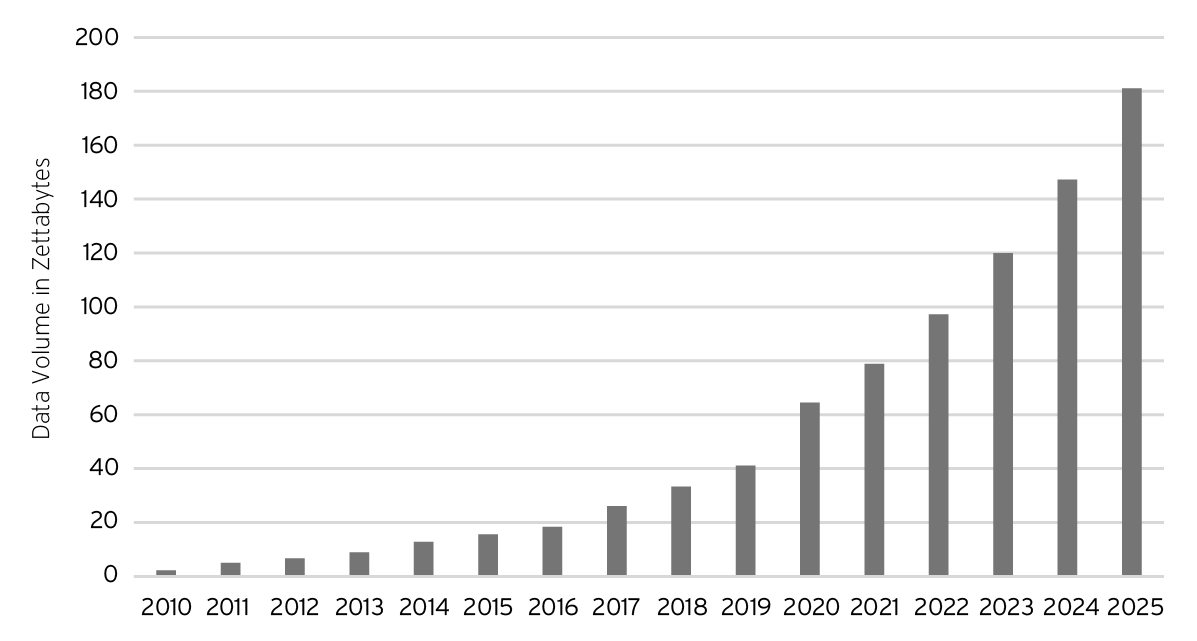
Source: Statista 2022; Chart shows the estimated annual volume of data/information created, captured, copied and consumed globally in zettabytes. A zettabyte is equal to 1 bilion terabytes.
Given the recent rally in technology stocks (NASDAQ up YTD 30.1% as of June 22, 2023)14, technology-focused equity hedge funds will focus on long investments that will benefit from longer-term trends in areas like AI, cybersecurity, cloud, and 5G. There is also a potential opportunity to be short companies that may face near-term cyclical headwinds, lack a competitive advantage, and/or are being disrupted by new competitors.
Managers that have strong track records of identifying winners and losers in the technology ecosystem have the potential to generate value.
Energy security
Humanity today is facing a wide array of pressing challenges, including poverty, food insecurity, aging populations, social inequities, and climate change. Facing these challenges will require significant investment over the coming years and components of investment portfolios can seek environmental and/or social benefits alongside competitive financial returns.
According to Bloomberg, $1 of every $3 invested will be invested sustainably, representing $53 trillion globally by 2025.15 As ESG-aware investing evolves, we have seen asset managers take a variety of approaches to the space. For hedge funds, certain managers have looked to implement an “ESG integration” approach within their portfolios. This is a technique that considers ESG data and metrics to favor underlying investments with attractive ESG attributes and/or disfavor investments that have unattractive ESG attributes, while seeking to generate returns.
In private equity, the climate-tech venture capital market has increased significantly, with climate representing the fastest growing sector within venture capital, with an 84% CAGR since 2012 (FIGURE 14). While there has been a great expansion in investment in climate across all asset classes, the venture capital sector is uniquely positioned to be the innovation engine for effective solutions that can be deployed effectively. Currently, the focus is on venture, as the pipeline in growth-stage opportunities continues to build. Emerging climate tech startups are targeting a broad range of industries as they seek to add tangible utility and value to end consumers and business while simultaneously decarbonizing the economy. The opportunity to fund these companies in the early- to mid-stage remains attractive as the total addressable market continues to mature.
For hedge funds, certain managers have looked to implement an “ESG integration” approach within their portfolios.This is a technique that considers ESG data and metrics to favor underlying investments with attractive ESG attributes and/or disfavor investments that have unattractive ESG attributes, while seeking to generate returns.
In private equity, the climate-tech venture capital market has increased significantly, with climate representing the fastest growing sector within venture capital, with an 84% CAGR since 2012 (FIGURE 14). While there has been a great expansion in investment in climate across all asset classes, the venture capital sector is uniquely positioned to be the innovation engine for effective solutions that can be deployed effectively. Currently, the focus is on venture, as the pipeline in growth-stage opportunities continues to build. Emerging climate tech startups are targeting a broad range of industries as they seek to add tangible utility and value to end consumers and business while simultaneously decarbonizing the economy. The opportunity to fund these companies in the early- to mid-stage remains attractive as the total addressable market continues to mature.
Figure 14. Climate-Tech Venture Capital Activity
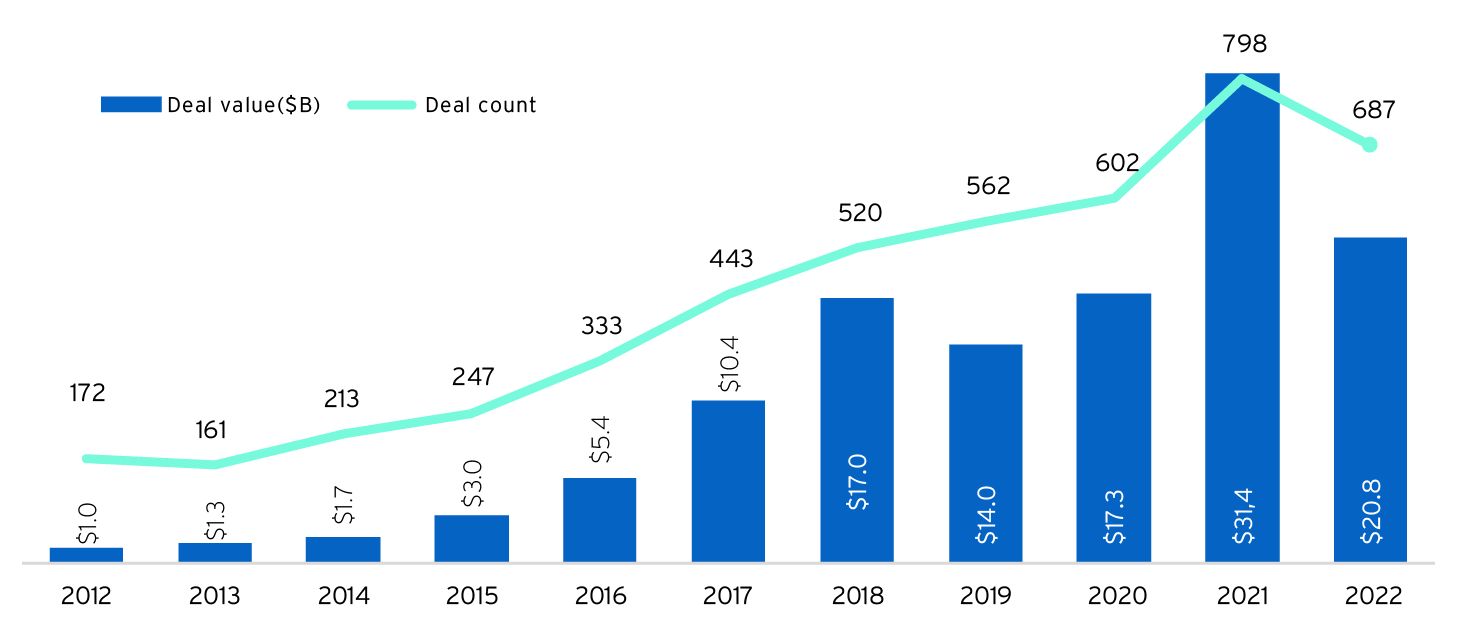
Source: Pitchbook, as of September 30, 2022. Chart shows venture capital deal activity measured by individual deal numbers and total deal volume in billions of US dollars
G2 – The rise of Asia
As discussed in Wealth Outlook 2023: Mid-Year Edition, our investors have overweighted USD investments through the past decade as the US Dollar has been the dominant global currency. But as qualified investors re-evaluate the geographic diversification of their portfolios, they should also examine their long-term exposures to alternatives assets. Rather than looking at potential short-term currency factors, less liquid assets such as private equity, real estate and hedge funds should be viewed through a lens of long-term factors and local market dynamics that may drive returns.
For example, the continued shift in economic power towards Asia has been an unstoppable trend for several years. We continue to focus on potential investment opportunities in developed Asia and greater China for both returns and diversification, while also being consistent with other thematic trends.
Chinese A-shares were in a steep selloff from June 2021 to October 2022, drawing down 37%. The selloff was due to a combination of global market conditions, including rising rates, inflation, and the possibility of recession weighed on stocks as well as China-specific concerns including COVID lockdowns, a contracting housing market, and an uncertain regulatory environment. The equity markets have reversed some of those losses due to the government introducing new policy measures around reopening from COVID Zero and improved real estate, financing, and tech investment plans. Despite this modest recovery, as we are seeing in the West, Chinese equities are trading at forward earnings multiples near five-year lows, providing a potentially attractive entry point for investment. The China A-share market is also inefficient due to low institutional ownership and high trading volumes dominated by local retail investors, allowing specialist active managers to profit from stock picking.
Within this context, we have also seen the maturation of the Asia private equity sector with significant fundraising and capital deployment activity over the past few years. However, the pace of investments in Asia far outstrips exits as compared to the US. From 2011 through 1H 2022, the median investment-to-exit ratios (amount invested/exit proceeds) of China and India are approximately 8.2x and 5.9x, respectively, whereas that of the US is approximately 2.0x. As of 1H 2022, the un-exited principal in the Asia Pacific region has reached $1.2 trillion.16 This creates an even greater need for investor liquidity in Asia and has created a meaningful overhang of un-exited principal. Yet, the secondary private equity market in the region is much less mature than in the US and Europe. While Asia historically has represented nearly 20% of global private equity fundraising and deployment over the past few years, it has only represented about 7% of the global secondary market. Therefore, specialists in GP-led secondaries in Asia may be well positioned to capitalize on this environment.
We are also seeing differentiated real estate opportunities in certain Asian developed markets. For example, unlike other parts of the world, COVID did not have a material disruption on office occupancy rates in the commercial real estate market in Japan’s major cities. Higher return to office rates have been driven by cultural preferences and demographic factors such as age, childcare needs, and relatively small residential space than other global markets such as the US or Europe. With a GDP of $4.9 trillion, Japan has the third largest economy in the world and Tokyo is the largest real estate market in the world with approximately 37.7 million people and 1.5 billion square feet of office space, more than 2x New York and 5x London.17 In addition to the office demand, while interest rates have been rising in the rest of the world, the Bank of Japan has aggressively kept interest rates low, creating an attractive financing and currency environment for non-Yen denominated investors. Thus, making Japan one of the few markets where the spread between cap rates and interest rates remain attractive for the office sector.
As of March 31, 2023, the spread between Japan 10-year treasuries and the average cap rates for grade A office space in Tokyo and Osaka was 242bps.18
What to do now
We suggest that qualified investors maintain a disciplined, multi-year and cross-cycle approach to allocating capital to alternatives. In uncertain times like these, there is a natural urge to maintain high cash balances, yet we feel that in times like these, alternative investments are an avenue for investors to be opportunistic, while maintaining long-term discipline.
Across multiple alternatives strategies such as credit, buyouts, secondaries and hedge funds, there are myriad ways for qualified investors to engage in the current market environment through alternatives that are simply not available nor feasible through traditional asset classes.
As was emphasized in our 2023 Alternatives Wealth Outlook earlier this year, we believe that waiting until the dust settles would be a mistake. With the Citi Global Wealth Investments asset class Strategic Return Estimates of 17.6%, 10.6% and 9.1%19 for private equity, real estate and hedge funds, respectively, the current environment provides an opportunity to seek liquidity and market dislocations as they occur via specialized managers.
We see several potential opportunities for qualified investors to look to alternative investments to leverage market weakness and capital inefficiencies in a slowing economy over the coming months.
Contact us
To help put you in touch with the right Private Bank team, please answer the following questions.